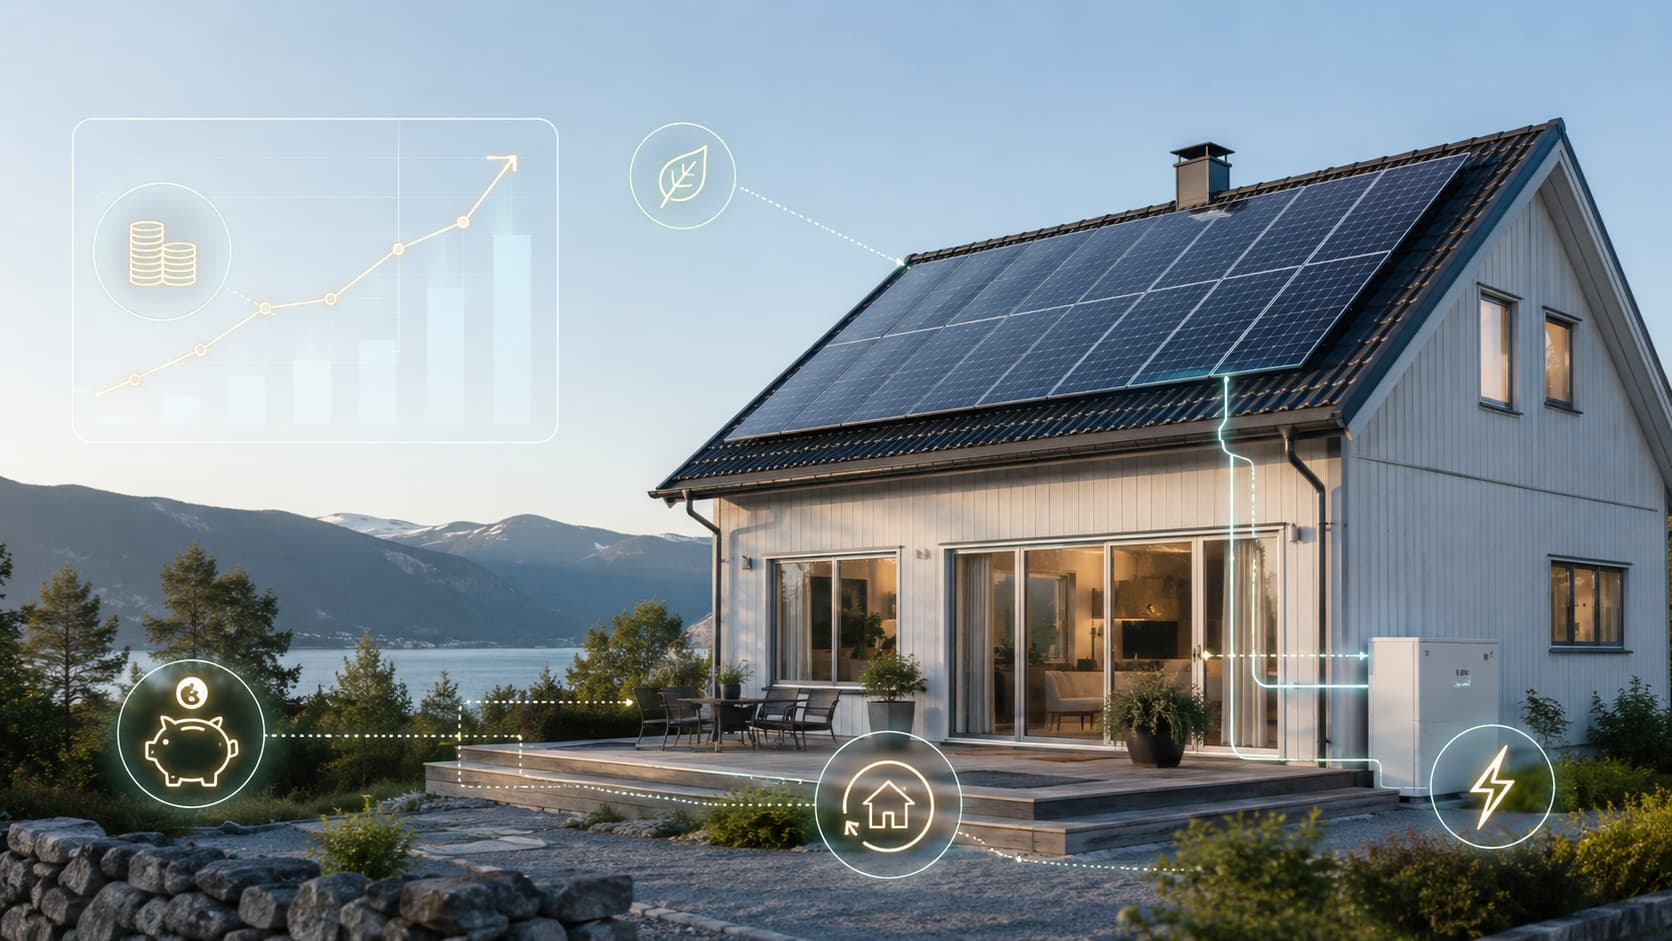
Solar panels are a significant upfront cost. The financial question most homeowners ask is straightforward: how long before the system pays for itself?
The answer ranges from under 5 years in the best conditions to 15 years in challenging ones. That range is not random. Five factors determine where your situation falls: installation cost, electricity price, self-consumption rate, export tariff and available grants. This article covers each one.
What payback period means
Payback period is the number of years it takes for cumulative savings to equal the net installation cost. A system costing $12,000 after grants that saves $1,400 per year pays back in roughly 8.5 years. Every year after that point contributes positive net savings, before any major replacement or financing costs.
A simple payback calculation treats savings as flat from year to year. A more accurate model adjusts for two things: electricity prices tend to rise each year, making each kilowatt-hour of self-consumed solar more valuable over time, and panels lose a small amount of efficiency annually, so later years produce slightly less than earlier ones.
Both effects matter. Rising electricity prices work in your favour. Panel degradation works against you, though only modestly.
Electricity price: the biggest lever
Solar panels save money by generating electricity your household would otherwise buy from the grid. The higher your electricity rate, the more each kilowatt-hour of solar production is worth.
Rates vary considerably by market. In Germany, residential electricity typically costs €0.35 to €0.40 per kWh. In Australia, roughly AUD $0.25 to $0.40 per kWh depending on state and tariff. In the UK, around £0.24 to £0.28 per kWh. In the US, $0.12 to $0.20 per kWh depending on state. In Norway, around NOK 1.00 to 1.80 per kWh depending on the season and region.
A household in Germany with high electricity prices will see noticeably faster payback than an equivalent household in a US state with cheap electricity, even with identical panels and installation costs. Check your most recent bill for your local rate before running any payback calculation.
Self-consumption rate: often underestimated
Solar panels generate electricity during daylight hours. Most households draw the bulk of their electricity in the morning and evening. That timing mismatch means a significant share of solar production goes to the grid rather than directly into the home.
Self-consumption rate is the percentage of solar production your household consumes directly. The rest is exported. Without a battery, typical self-consumption rates run 30 to 50 percent. With a home battery that stores surplus daytime production for evening, rates of 65 to 80 percent are achievable.
This matters enormously because self-consumed electricity saves at full retail price. Exported electricity earns only the feed-in or export tariff, which is typically 30 to 60 percent of retail price in most markets.
Export tariff: what you earn on surplus electricity
Most markets offer some form of payment for electricity sent back to the grid. Rates and rules differ significantly.
In the UK, the Smart Export Guarantee requires energy suppliers to offer a tariff for exported electricity, with rates typically ranging from 3p to 15p per kWh depending on supplier and tariff type. In Germany, the Einspeisevergütung pays a regulated feed-in rate that has varied over the years. In Australia, feed-in tariffs range from about AUD $0.05 to $0.12 per kWh depending on state and retailer. In the US, net metering policies differ by state and utility, with some allowing full retail credit for exports and others paying a wholesale rate.
Export tariffs are typically fixed by contract or regulation for a set period. They do not automatically rise with retail electricity prices. This is why maximising self-consumption has a greater effect on payback than seeking a slightly higher export rate. Every kilowatt-hour shifted from export to self-consumption is worth the difference between retail and export price.
Grants and subsidies
Grants reduce the net installation cost directly. Since payback period is calculated as net cost divided by annual savings, a grant that cuts net cost by 25 percent reduces payback by 25 percent. A system with a 12-year payback becomes a 9-year payback with a 25 percent grant. That is a material difference.
What is available varies significantly by country and changes frequently.
| Country / region | Key scheme (as of 2026) | Typical benefit |
|---|---|---|
| Australia | Small-scale Technology Certificates (STCs) | AUD $2,000–$5,000 off purchase price of typical system |
| United States | Federal residential solar tax credit expired for new homeowner installations after 2025 | Check current state, utility and third-party ownership incentives |
| Germany | KfW low-interest loans + feed-in tariff | Reduced financing cost + regulated export income |
| Norway | Enova household grant | 25% of approved costs, capped at NOK 2,500 per installed kW up to 15 kW |
| UK | Zero-rate VAT on eligible residential installation + Smart Export Guarantee | 0% VAT on eligible residential installation costs until March 2027, compared with the reduced 5% rate scheduled from April 2027 |
| Sweden | ROT-avdrag (tax deduction for labour) | 30% of labour cost deducted from tax bill |
Always verify current schemes before budgeting. Programmes are adjusted regularly and eligibility rules vary. The difference between a market with and without meaningful grants is often 3 to 5 years of payback.
Panel degradation
Solar panels lose a small percentage of their output efficiency each year, typically 0.3 to 0.8 percent annually. Most manufacturers guarantee at least 80 percent of rated power after 25 years, which corresponds to roughly 0.5 to 0.8 percent per year.
At 0.5 percent degradation, a system producing 5,000 kWh in year 1 will produce approximately 4,400 kWh by year 25. That is a 12 percent reduction over the lifetime of the system. Production in the early years is higher than in later years, which means the payback calculation that ignores degradation slightly overestimates long-term returns. The effect is real but not dramatic for most residential systems.
Inverters are a separate consideration. Most residential inverters need replacing at 10 to 15 years. The cost varies by system size, inverter type and market. Factor this into any lifetime calculation.
Typical payback ranges by region
| Region | Typical payback range | Key driver |
|---|---|---|
| Southern Europe, Australia, SW United States | 5–8 years | High sunshine + high electricity price |
| Central Europe, UK, SE Australia | 8–12 years | Moderate sunshine, elevated electricity price |
| Northern Europe (without grants) | 10–15 years | Lower sunshine hours offset by rising electricity prices |
| Northern Europe (with grants) | 7–11 years | Grants reduce net cost by 25–35% |
| US midwest / northeast (no state incentives) | 9–13 years | Lower electricity rates slow payback |
These ranges are broad planning estimates, not guaranteed outcomes. Local conditions (roof orientation, shading, local electricity tariff structure and specific installer pricing) affect the result significantly.
Common mistakes in payback calculations
- Assuming high self-consumption without checking habits. If your household draws most of its electricity in the evening, a self-consumption rate of 70 percent is not realistic without a battery. 30 to 40 percent is a more honest starting assumption for many daytime-absent households.
- Taking production estimates from marketing materials. Installer quotes often present optimistic annual production figures. Ask for the P90 estimate, meaning the figure that 90 percent of years are expected to meet or exceed, rather than the average.
- Ignoring inverter replacement. An additional €1,000 to €1,500 at year 12 changes the total cost picture. Factor it into lifetime calculations.
- Not checking available grants. A 30 percent tax credit changes the payback period by several years. Calculating payback without applying available grants gives a misleading picture of what your system will actually cost.
- Comparing across very different locations. A payback period quoted for Spain tells you nothing useful about the same system in Scotland. Always ask for location-specific projections from your installer.
Calculate your solar payback
Enter your annual production, installation cost, electricity price and self-consumption rate to see your payback period, lifetime ROI and 25-year net savings.
Open Solar Panel Payback Calculator →If you do not yet have an annual production estimate, the Solar Panel Calculator gives a starting figure based on system size and location. Bring that number to the payback calculator for the financial analysis.